


The Valley of Danger -- medium speed roads for robocars
Submitted by brad on Fri, 2014-01-10 11:19
Topic:
With last week's commercial release of the Navia, I thought I would release a new essay on the challenges of driving robocars at different speeds.
As the Navia shows, you can be safe if you're slow. And several car company "traffic jam assist" products say the same thing. On the other end, we see demos taking place at highway speeds. But what about the middle range -- decent speeds on urban streets?
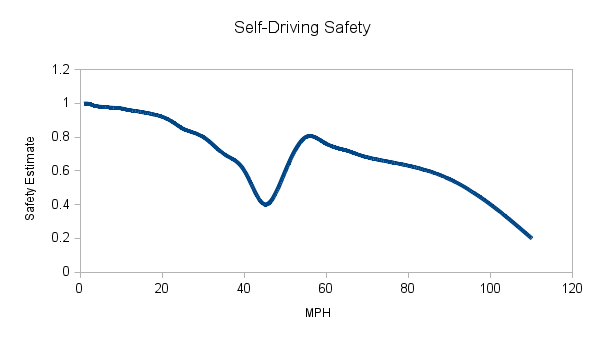
Turns out that's one of the harder problems, and so there is a "valley" in the chart which makes safe operation harder in that zone.
So read my more detailed essay on these challenges: The Valley of Danger for Robocars
Share on:


Comments
John Moore
Fri, 2014-01-10 21:15
Permalink
Why not vision as sensor?
I certainly haven't followed robocars as closely as you have. I have for a while had the following question: why is everyone using RADAR/LIDAR when humans use vision?
Is the problem that vision AI is not yet advanced enough?
Vision does away with the problem of interference, and reduces or eliminates the problem of range mentioned in your referenced article.
Also, cars could use enhanced vision - telephoto for parts of the field of view (i.e. non-uniform magnification), expanded wavelength ranges, etc.
Just curious.
brad
Sat, 2014-01-11 00:37
Permalink
That was covered earlier
Lasers vs. Cameras
John Niles
Wed, 2014-01-29 12:14
Permalink
valley of danger
Seems to me that speed is less the issue than traffic complexity. Limited access, multi-lane divided expressways are relatively easy for automated driving at any speed that is acceptable for the present level of traction.
Urban and rural streets/roads/highways with driveways and intersections are a more difficult environment for robocars at any speed, and more difficult as speed increases. A trivial truism is that the tougher environments begin just off the expressways in urban areas.
I recently shot a brief video of what seems to me a typically tough intersection for robotics at the end of an expressway ramp, at https://www.facebook.com/photo.php?v=575149412578075. It's a yield-merge right turn lane into an active cross-lane at a signal-controlled intersection with restricted visibility of crossing vehicles coming from the left. It is also an unsignalized pedestrian crossing.
Chuck Karish
Sat, 2018-03-24 13:53
Permalink
Why graph safety rather than danger?
Risk that any of a class of outcomes will come to pass is something we can model and reason about. Safety is a more slippery. A dip in the graph of safety - a reduction of not-risk - makes me try to visually understand a double negative.
brad
Sat, 2018-03-24 14:05
Permalink
A valley
I chose that metric because people understand the idea of a valley. People's instinct is that higher is better, ie. safer. Lower numbers are bad.
Add new comment