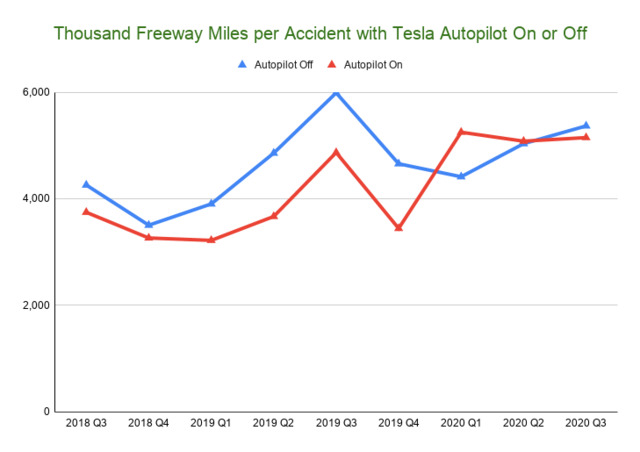
Tesla released the latest safety numbers for the 3rd quarter. I decided to put all the numbers on a chart, but corrected for the fact that Autopilot is used almost exclusively on freeways, while non-Autopilot use is a 40-60 mix. The result is that Autopilot and non-Autopilot safety are fairly similar, with Autopilot maybe slightly worse.
Also a new review from Consumer Reports rates GM Super Cruise higher than Autopilot, but only because it has more driver monitoring and blocks off-freeway use.
That the ratio of accidents highway to non-highway is around 3-1 is not a guess. That this would be the ratio for Tesla drivers not using autopilot is not a guess. That it would be the ratio for drivers on Autopilot is not something I have data for but it's a reasonable assumption, and because Autopilot is 94% freeway, it's not that strong an assumption -- it would have to be way off to alter the core of the chart.
But you'll probably get away with it. Tesla would have to open itself up to discovery in order to sue you for lying about them.
(I don't see the word "estimated" anywhere on your chart, let alone "numbers made up by someone who frequently tries to say negative things against Tesla".)
The math and uncertainty are well explained in the article with the chart.
Says negative things about Tesla? You haven't been reading me. I own a Tesla. It's the best car out there.
I've wondered about this ever since Tesla started posting these safety reports. It seemed that reasonable assumptions should be available even if Tesla doesn't provide them. I'm glad you went looking for them.
I've wondered about this ever since Tesla started posting these safety reports. It seemed that reasonable assumptions should be available even if Tesla doesn't provide them. I'm glad you went looking for them.
The study of the places were autopilot is used was not done by Tesla, it has exact data. Indeed, Tesla would have exact data on how many airbag engagements are on highway and how many not.
However, these crashes are still random events and the rate varies a great deal from quarter to quarter, so they are just an approximation of the true number we're after, even if all airbag deploys in the quarter are measured, as each quarter differs in what roads are driven and many, many other factors.
I have driven my new Model Y for 3 months now and from personal experience, my impression is that it is the safest car I have ever driven. It warns me if it thinks I am going out of lane or that it sees, yes, sees that the car in front of me has slowed. All while being the fastest car with the best brakes I have ever had. I highly recommend that you drive one and judge for yourself.
Can you share the numbers that led to this comment….” They also report an unrelated number from NHTSA for “crashes” which is almost an order of magnitude different from the Tesla numbers. The NHTSA number is derived from police reports.”
Thanks for all the leg work here. It’s be interesting to hear how insurance companies charge a premium/discount, that could be a very interesting data point from the ones that have a lot of skin in it.
So would that suggest Tesla cars are more likely to be in an accident (is that what your numbers say) and confirming the insurance… its higher on average but not sure of the components of why.


Comments
FKA
Sat, 2020-10-31 06:18
Permalink
fake news
That chart is based on your guesstimate?
brad
Sat, 2020-10-31 11:30
Permalink
I would call it an estimate
That the ratio of accidents highway to non-highway is around 3-1 is not a guess. That this would be the ratio for Tesla drivers not using autopilot is not a guess. That it would be the ratio for drivers on Autopilot is not something I have data for but it's a reasonable assumption, and because Autopilot is 94% freeway, it's not that strong an assumption -- it would have to be way off to alter the core of the chart.
FKA
Sat, 2020-10-31 17:37
Permalink
I would call it libel
But you'll probably get away with it. Tesla would have to open itself up to discovery in order to sue you for lying about them.
(I don't see the word "estimated" anywhere on your chart, let alone "numbers made up by someone who frequently tries to say negative things against Tesla".)
brad
Sun, 2020-11-01 10:49
Permalink
Says negative things about Tesla
The math and uncertainty are well explained in the article with the chart. Says negative things about Tesla? You haven't been reading me. I own a Tesla. It's the best car out there.
FKA
Sun, 2020-11-01 19:11
Permalink
the article
The article explains that you're making a bunch of assumptions, many of them dubious.
I've been reading you for quite a while.
Random
Tue, 2021-01-05 09:45
Permalink
Thanks!
I've wondered about this ever since Tesla started posting these safety reports. It seemed that reasonable assumptions should be available even if Tesla doesn't provide them. I'm glad you went looking for them.
Random
Tue, 2021-01-05 09:45
Permalink
Thanks!
I've wondered about this ever since Tesla started posting these safety reports. It seemed that reasonable assumptions should be available even if Tesla doesn't provide them. I'm glad you went looking for them.
Michael Stephen...
Tue, 2021-04-20 19:23
Permalink
margin of error?
"4% is really within the margin of error"
What margin of error? These are exact measurements, are they not?
brad
Sun, 2021-05-02 10:54
Permalink
Exact measurements
The study of the places were autopilot is used was not done by Tesla, it has exact data. Indeed, Tesla would have exact data on how many airbag engagements are on highway and how many not.
However, these crashes are still random events and the rate varies a great deal from quarter to quarter, so they are just an approximation of the true number we're after, even if all airbag deploys in the quarter are measured, as each quarter differs in what roads are driven and many, many other factors.
Daniel Mirkin
Sun, 2021-09-05 06:49
Permalink
Tesla Safety
I have driven my new Model Y for 3 months now and from personal experience, my impression is that it is the safest car I have ever driven. It warns me if it thinks I am going out of lane or that it sees, yes, sees that the car in front of me has slowed. All while being the fastest car with the best brakes I have ever had. I highly recommend that you drive one and judge for yourself.
R5
Wed, 2022-01-19 16:20
Permalink
Great Work
Can you share the numbers that led to this comment….” They also report an unrelated number from NHTSA for “crashes” which is almost an order of magnitude different from the Tesla numbers. The NHTSA number is derived from police reports.”
Thanks for all the leg work here. It’s be interesting to hear how insurance companies charge a premium/discount, that could be a very interesting data point from the ones that have a lot of skin in it.
brad
Wed, 2022-01-19 19:17
Permalink
NHTSA stats
https://crashstats.nhtsa.dot.gov/Api/Public/ViewPublication/813209
About 3 trillion miles driven in the USA per year.
R5
Thu, 2022-01-20 16:38
Permalink
So would that suggest Tesla
So would that suggest Tesla cars are more likely to be in an accident (is that what your numbers say) and confirming the insurance… its higher on average but not sure of the components of why.
Add new comment